

Dashboards, Graphs & Reports all with one click!
Summary:
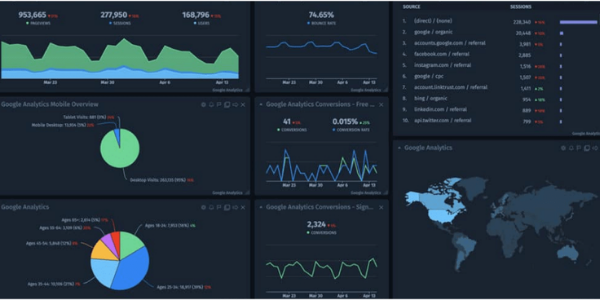
Built In Dashboards, Graphs and Reports within Klipboard CRM means there is no requirement for any data processing as in-depth information is available out-of-the-box.
The Problem:
Kyle ran a professional services firm with several sales and business development executives in multiple cities. Most of them had KPIs based incentives included in their remuneration. They varied from the number of leads generated to deal values initiated to deals closed. The incentive and remuneration structue was well liked by all and worked well for the firm. The challenge however was that the reports required to generate these numbers were not easy to get to. It required their Business Analyst several hours to pull out the base data and then construct these reports. In addtion, if the Business Analyst was on leave or busy with other priorities the incentive payments would get delayed due to non-availabilty at the time of payroll which meant that the sales and business development teams missed out on performance bonuses for that period. This then created some discontent among the team and also Kyle who was a bit frustrated with the complexity in generating these reports.

The Solution:
Kyle introduced Klipboard CRM within the business. The rollout was done within a couple of days as it was quite straight forward and easy to implement. All sales and business development executives were provided their own contact and lead boards which were either shared with others or were stand alone. But Kyle had access to all the boards. Each contact and pipeline deal was entered onto a contact or deal card like a sticky note and progressed accordingly on the board. This visually simple and easy solution meant that just at a quick glance each team member as well as Kyle could see the progress of each lead and deal. The real added bonus was however the built in analytics and reporting that was available out-of-the-box in Klipboard CRM. Dashboards, Graphs and Reports were already available that showed the number of leads and deals as well as the pipeline value and many other KPIs and results.
The Result:
Ready-made reporting of all required KPIs meant that each team member as well as the management team had a clear view of performance instantly on demand. There was no need for the business analyst to collate and run reports at the end of the month as all information was easily accessed by each person based on their needs. This saved a huge amount of time and effort not just in terms of calculating and paying out incentives but also directly had an impact on the sales performance due to increased transparency. Klipboard CRM also allowed for downloads of data sets to build customised reports which is where the effort was redirected with the business analyst as that added a lot more value to the management team. The savings on time and effort and greater efficiency after implementing Klipboard CRM provided a huge boost to not just the entire business but also how it was perceived by his team and the business partners.